How To Get More Out Of NetSuite Analytics Warehouse
So you’ve rolled out NetSuite Analytics Warehouse (NSAW). You built a few dashboards, maybe tweaked some subject area reports, and your users are logging in. You’ve also replaced manual processes — no more spreadsheets where someone in finance or operations spends hours exporting saved searches and munging data. That’s a big win.
But now you’ve hit a wall. You’ve automated the painful stuff, you’ve got dashboards people can click through… and you’re thinking: What do I do next? How do I get more out of this thing?
You’re not alone, this is exactly where most companies get stuck.
To truly get the most out of NSAW (or any analytics tool), you need to understand that analytics has layers. Once you know how those layers build on each other, you can start matching them to your business goals and build a roadmap for “what’s next.”
The Four Stages of Analytics
Think of analytics like a staircase. Each step builds on the one below it.
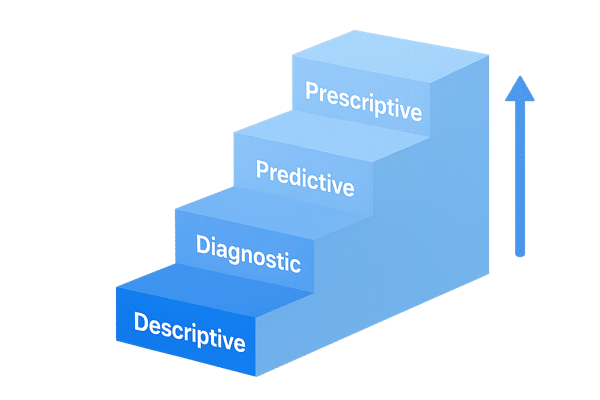
1. Descriptive Analytics – What happened?
This is where everyone starts. You’re reporting on the basics: sales by month, inventory on hand, margin by product line.
Examples in NSAW:
- Pulling sales orders and revenue data for the past five years.
- Looking at sales by month and noticing some months are consistently higher than others.
Descriptive analytics gives you a snapshot of what’s going on, but it’s just a view into the past.
2. Diagnostic Analytics – Why did it happen?
Here you’re not just looking at numbers; you’re trying to explain them.
Examples in NSAW:
- That spike in June sales? You overlay marketing campaign data and see June is when you always launch your summer promo.
- Your product is seasonal — snowblowers sell in December, patio furniture in May.
- In operations, purchase order lead times stretch in November because suppliers shut down for the holidays.
Diagnostic analytics takes the “what happened” from descriptive and adds the “why it happened.”
3. Predictive Analytics – What is likely to happen next?
This is where it gets exciting. Once you know what happened and why, you can forecast what’s about to happen.
Examples in NSAW:
- Using historical sales and seasonality data to predict that widget sales will jump 40% next June.
- Calculating that your vendor’s average lead time is 28 days, but during holidays it can stretch to 45.
- Spotting patterns: sales spikes in summer, delays in winter, stable demand in between.
Predictive analytics gives you a forward-looking view, but you can’t get here without first understanding the “why” from diagnostics.
💡 Quick Note: People often ask, “Can’t machine learning or AI just skip the diagnostic step?” Technically, ML can automate parts of the diagnostic work. But in practice, data scientists spend most of their time cleaning data and validating which factors actually drive outcomes. So even with ML, diagnostics always find their way back in.
4. Prescriptive Analytics – What should we do about it?
This is the stage every analytics team strives for. You’ve described, diagnosed, and predicted — now you can make smarter decisions.
Examples in NSAW:
- If you know widget sales spike in June and it takes 28–45 days to get more from your vendor, you don’t wait until May to order.
- Instead, you build a reorder model that says: “Order X units in April so you have them on hand for the summer rush.”
- You set thresholds that flag items at risk of stock-out and push reminders to your buyers.
Prescriptive analytics turns insight into action. It’s not just about reporting anymore, it’s about guiding business decisions.
What Do I Do Now?
A good way to figure out your next step is to treat it like a workshop with your team. Grab a whiteboard or sticky notes and start asking simple questions.
Begin with:
“What parts of our business feel like a black box?”
“Inventory. We don’t really know what’s on hand until someone
checks manually.”
That goes on the bottom of the pyramid, the descriptive layer.
It tells you that you need basic visibility: reports showing
current stock levels, what’s allocated to sales orders, and
what’s tied up in work orders.
Next, ask:
“What feels unpredictable or misunderstood?”
“We never know why we run out of certain items. Sometimes it’s
seasonality, sometimes it’s just delays from suppliers.”
Those notes sit on the diagnostic layer. They’re the “why”
questions that help you explain patterns in the data.
Finally, raise the bigger question:
“Wouldn’t it be great if we could predict when we’ll run out of
stock?”
- Do we have the descriptive data nailed down? Can we answer questions like, “How much inventory do we have right now?” or “What’s the average vendor lead time and sales volume?”
- Do we have the diagnostic data to explain the drivers? For example, “Does seasonality consistently affect sales?” or “Do certain suppliers extend lead times around the holidays?”
If those questions aren’t answered, it’s a signal to strengthen your foundation first. Predictive analytics is powerful, but it’s only reliable when it’s built on solid descriptive visibility and diagnostic understanding.
Taking this structured approach helps you avoid skipping steps. Instead of chasing flashy forecasts, you build confidence layer by layer and that’s what ultimately makes analytics useful for real business decisions.