How to Use Parameters in NSAW Dashboards for What-If Scenarios
In our last article, we explored how analytics can help companies navigate uncertainty, such as the impact of tariffs. In this article, we’ll take that idea a step further. We’ll walk through how to set up parameters in your NetSuite Analytics Warehouse (NSAW) dashboards to run what-if scenarios.
To make this concrete, let’s imagine we’re a car parts company that could be affected by tariffs. We’ll create a parameter that lets a user enter an estimated tariff rate and instantly see how that would affect margins. This approach can help you answer practical questions like:
- Do we need to source from new vendors?
- Are there products unaffected by tariffs that we can lean into?
- Do we need to consider raising prices?
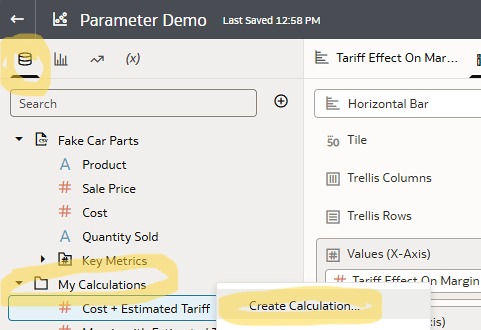
Step 1: Create a Parameter
- Open your workbook and go to the Visualize tab.
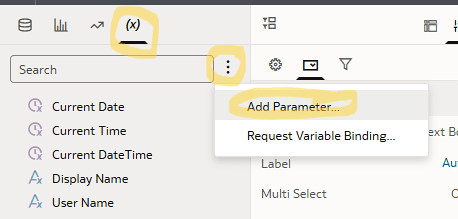
- In the top left corner, find the X in parentheses (x) icon. Click it to open the parameters list.
-
Use the three-dot menu to select
Add Parameter
.
- Give your parameter a clear name (e.g., Tariff Rate ). Add a description if needed.
- For data type, choose Double since the tariff will be a fraction.
-
Set an initial value (for example,
0.25for a 25% tariff).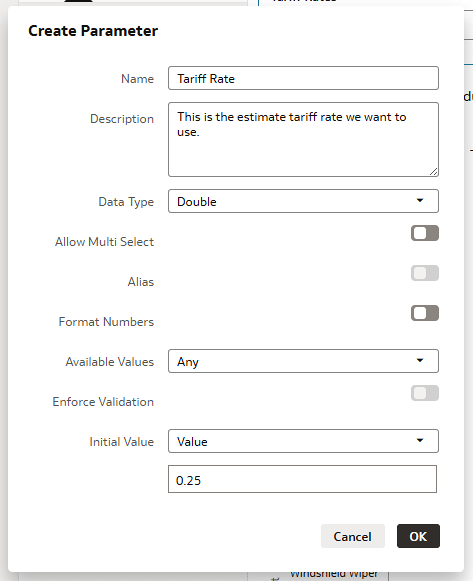
Step 2: Add the Parameter to the Dashboard
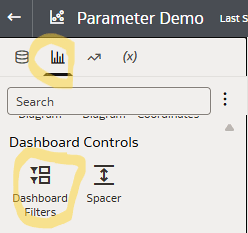
- On the left side, open Visualizations .
-
Scroll until you see
Dashboard Filters
, then drag it onto your canvas.
-
Go back to the Parameters panel and drag your
Tariff Rate
parameter onto the filter control.
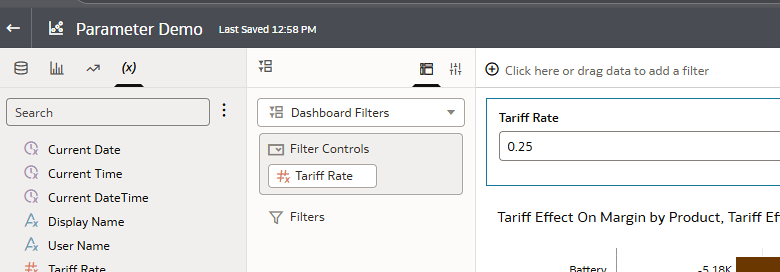
Now, your users can easily adjust the parameter value from the dashboard.
Step 3: Build a Calculation with the Parameter
We’ll use the parameter in a formula to calculate cost with tariffs included:
Cost * (1 + @parameter("Tariff Rate")(0.25))
Here, 0.25 is the default value used only if no parameter value is set.
Step 4: Add Margin Calculations
Next, let’s calculate margin with tariffs applied:
-
Prior Year Margin Including Tariff
(Sales Price * Quantity Sold) – (Cost Plus Estimated Tariff * Quantity Sold) -
Margin With Estimated Tariff
Sales Price – Cost Plus Estimated Tariff
These give us both a historical dollar impact and a per-product view of margin changes.
Step 5: Build the Dashboard Views
- High-Level Impact: Drag your new margin calculations onto the dashboard to visualize dollar impact by product.
-
Detailed Tab:
Add a table with:
- Product
- Sales Price
- Current Cost
- Cost Plus Estimated Tariff
- Current Margin
- Margin With Estimated Tariff
This detail view shows exactly which products are most affected.
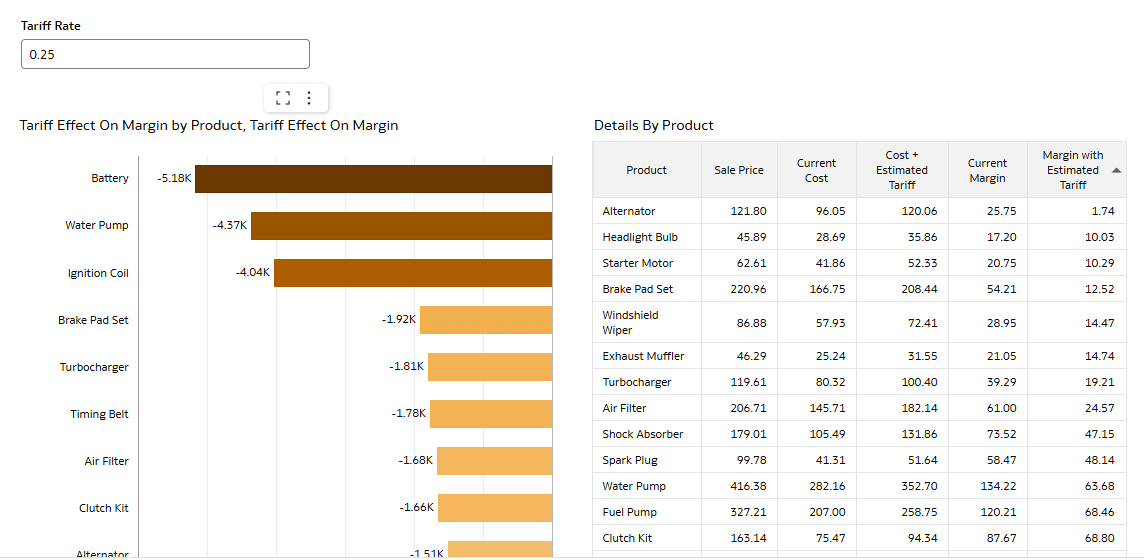
Example Analysis
Using sample data, we can see:
- Tariffs on batteries have the largest dollar impact due to sales volume.
- Alternators see their margin shrink dramatically—from $25 down to $2 with a 25% tariff.
- At a 50% tariff rate, seven products flip to a negative margin, with brake pad sets being hit the hardest.
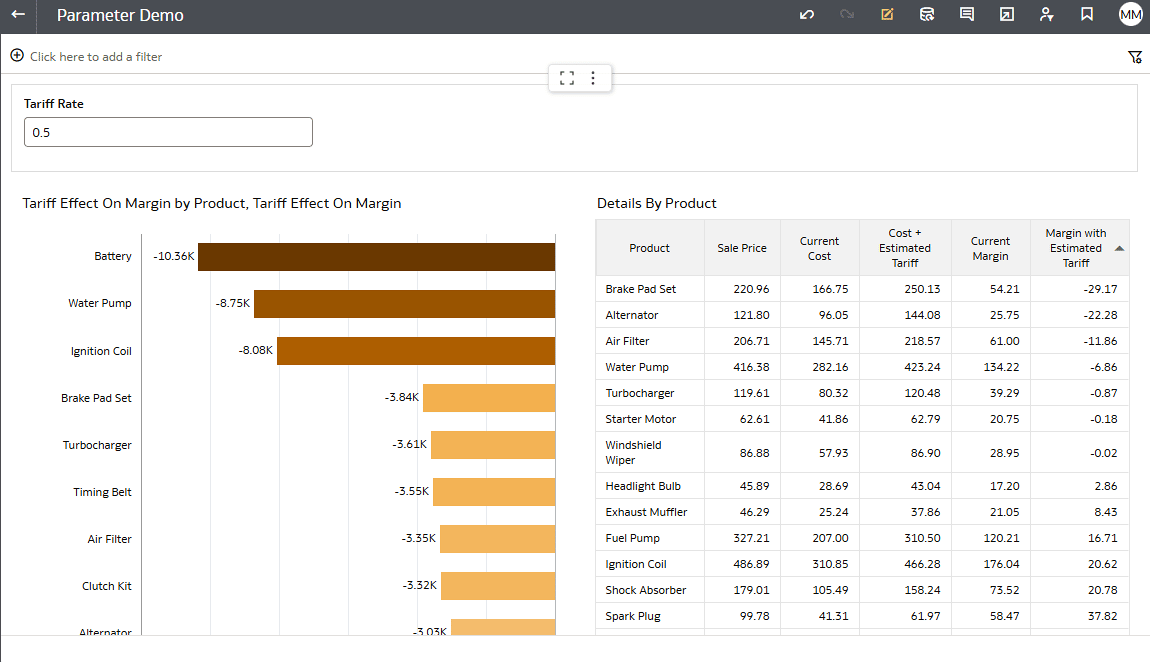
With this knowledge, you can explore sourcing alternatives or consider pricing adjustments before issues hit the bottom line.
Takeaway
Parameters are a simple but powerful feature in NSAW. By adding them to your dashboards, you can simulate different conditions and prepare for uncertainty. Whether it’s tariffs, shipping costs, or raw material prices, what-if scenarios give you a head start on making better decisions.